2022 Mathematical Contest In Modeling: Trading Strategies
This project focuses on developing a Profitable Low-Risk MACD (PLR-MACD) model, which generates daily trading signals based on technical analysis using the Moving Average Convergence Divergence (MACD) indicator. By refining the standard MACD model with additional buying and selling criteria, the PLR-MACD model reduces trading frequency and mitigates risk while maintaining profitable opportunities. A comparison with the traditional buy-and-hold strategy demonstrates that while the model sacrifices some potential profits, it significantly lowers drawdown and performs better in downtrend markets, offering a more conservative and risk-averse trading strategy.
Problem Statement
Market traders buy and sell volatile assets frequently, with a goal to maximize their total return. There is usually a commission for each purchase and sale. Two such assets are gold and bitcoin.
You have been asked by a trader to develop a model that uses only the past stream of daily prices to date to determine each day if the trader should buy, hold, or sell their assets in their portfolio. You will start with $\$$1000 on 9/11/2016. You will use the five-year trading period, from 9/11/2016 to 9/10/2021. On each trading day, the trader will have a portfolio consisting of cash, gold, and bitcoin [C, G, B] in U.S. dollars, troy ounces, and bitcoins, respectively. The initial state is [1000, 0, 0]. The commission for each transaction (purchase or sale) costs α% of the amount traded. Assume $\alpha_{gold} = 1\%$ and $\alpha_{bitcoin} = 2\%$. There is no cost to hold an asset.

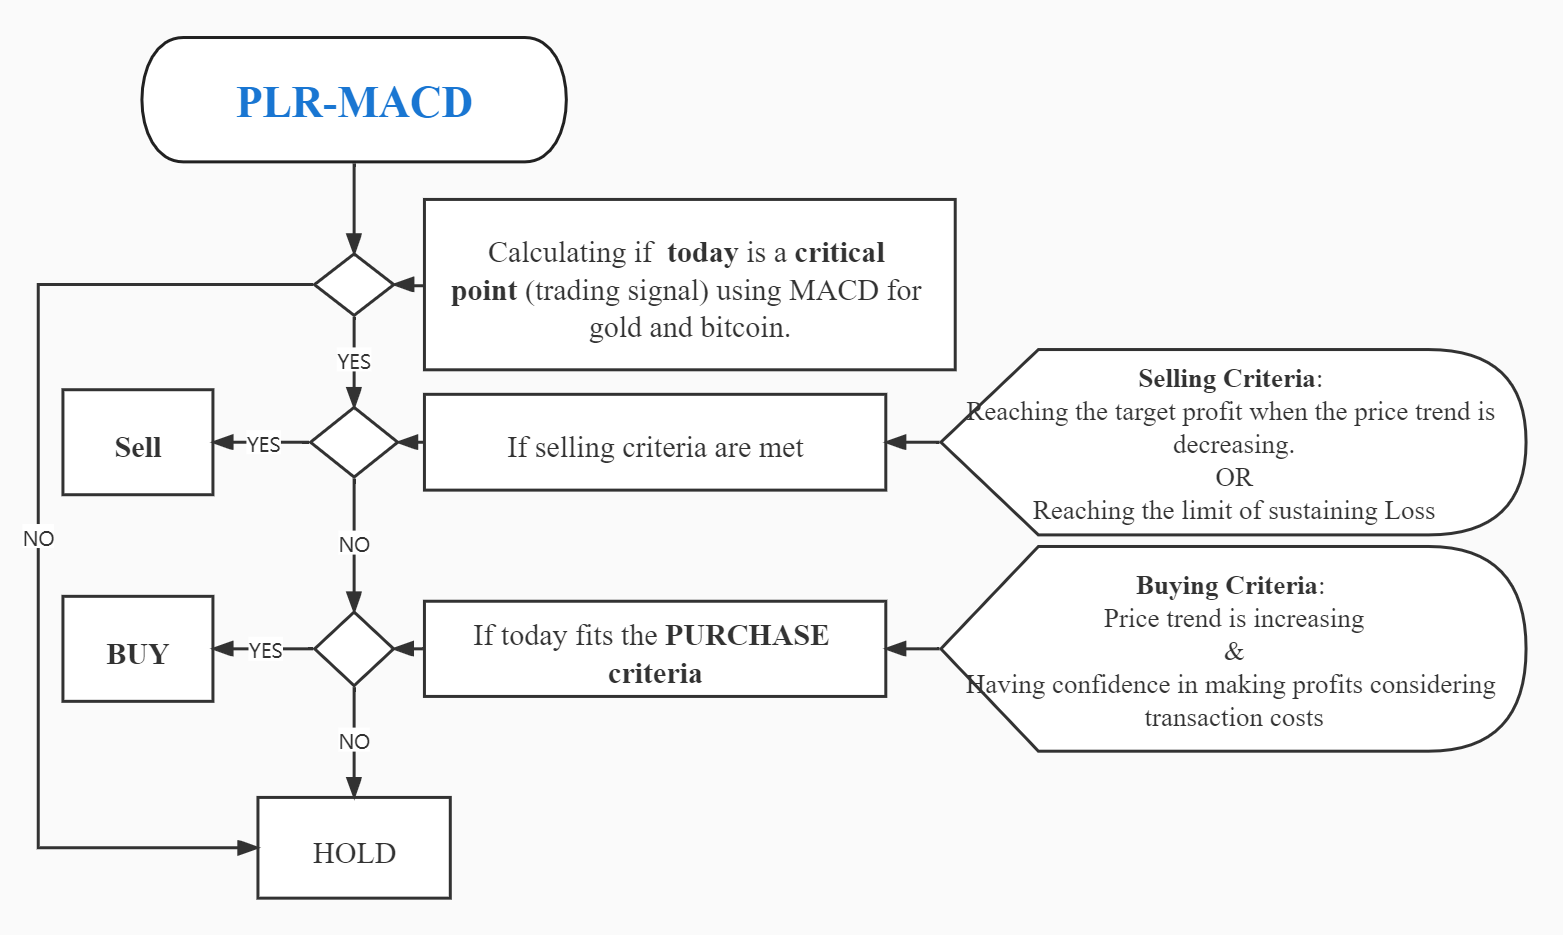
Our Approach
To predict future price trends, we begin by establishing a basic model using the Moving Average Convergence Divergence (MACD) indicator. The MACD line is constructed by subtracting the long-term Exponential Moving Average (EMA) from the short-term EMA. Next, a 9-day EMA of the MACD line, known as the signal line, is plotted alongside the MACD line.
There are two common trading interpretations of the MACD indicator: signal-line crossover and zero crossover. Each has its strengths and weaknesses, and we choose to focus on the signal-line crossover interpretation. Our basic model is then built using the MACD indicator and the signal-line crossover interpretation.
To enhance our basic model, we developed a series of additional indicators, including expected future price, the rate of change of the price EMA, a selling threshold, a downtrend detector, and a stop-loss threshold. This refined model is called the Profitable Low-Risk MACD (PLR-MACD) model. We then tested the buy-and-hold strategy, our basic model, and the refined model using the provided data. Finally, we analyzed their trading performance using the rate of return and absolute drawdown (the difference between the initial deposit and the lowest point).
Results and Evaluation
We invested $\$500$ in gold and $\$500$ in Bitcoin on the first day. By 9/10/2021, using the buy-and-hold strategy, the initial $\$1,000$ investment grew to $\$37,585.77$ with total commissions of $\$15$. With the basic MACD model, the investment increased to $\$2,541.49$, incurring total commissions of $\$233.77$. Using the refined PLR-MACD model, the investment reached $\$21,096.36$, with total commissions amounting to $\$760.44$.

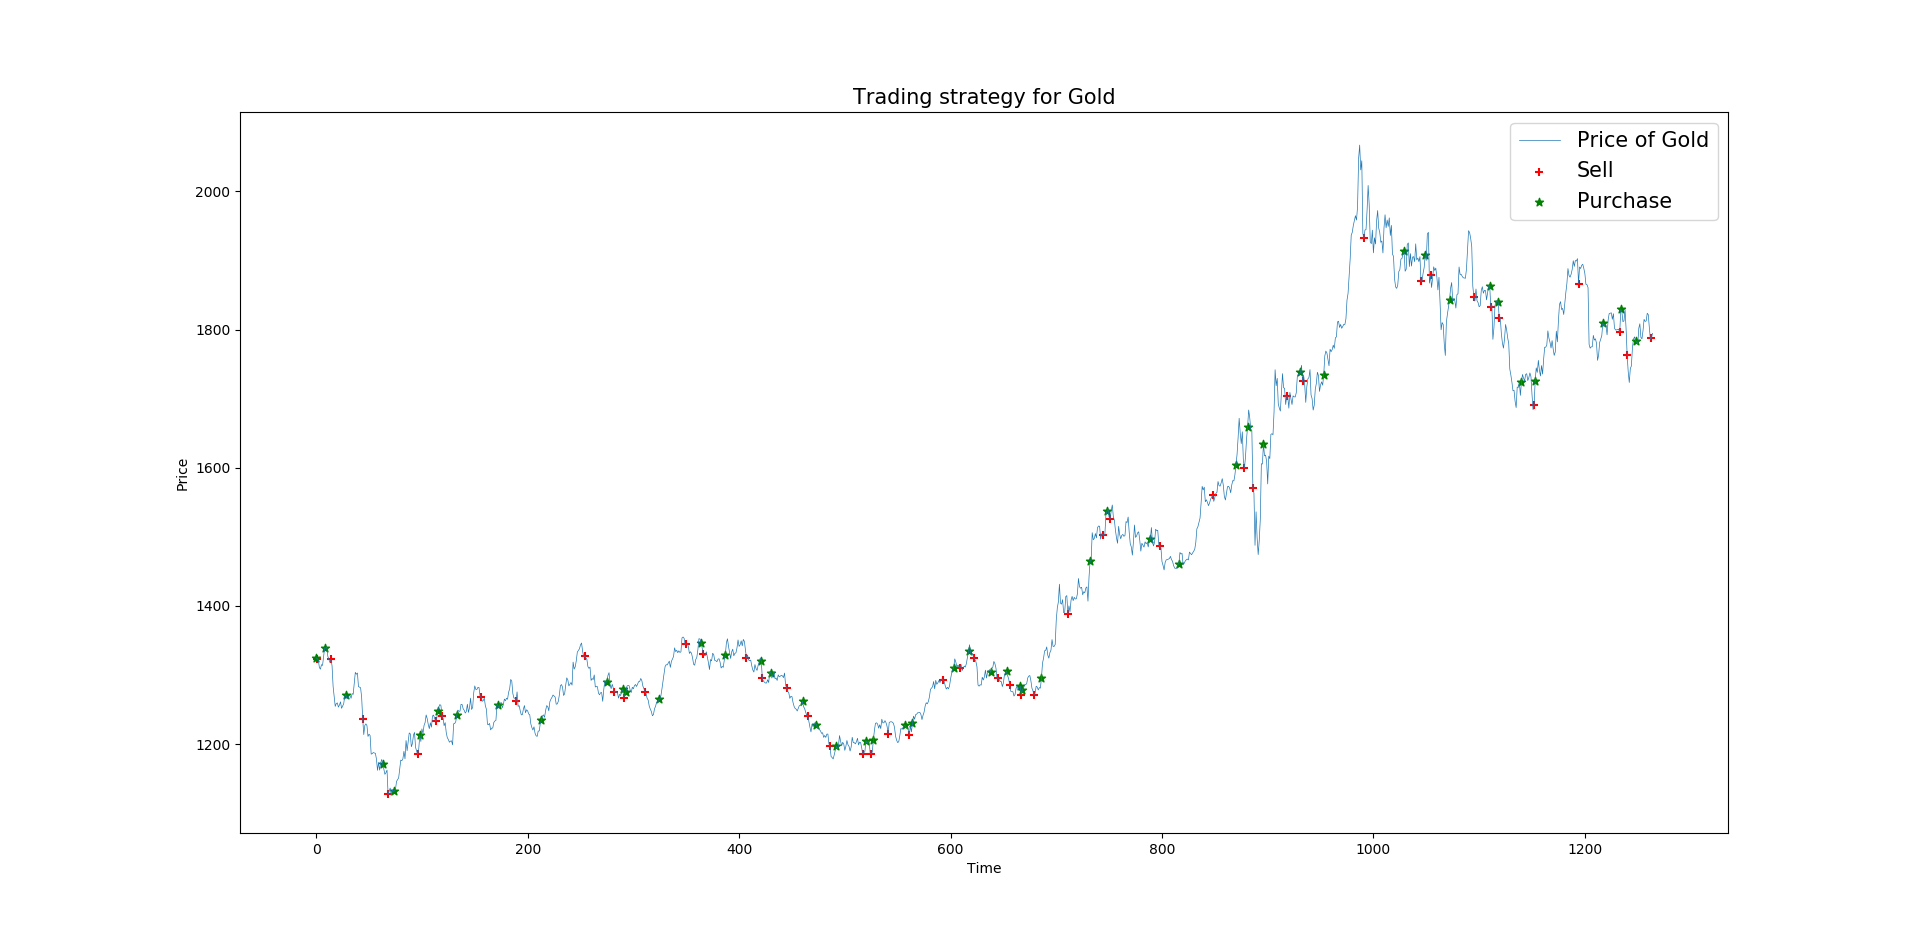
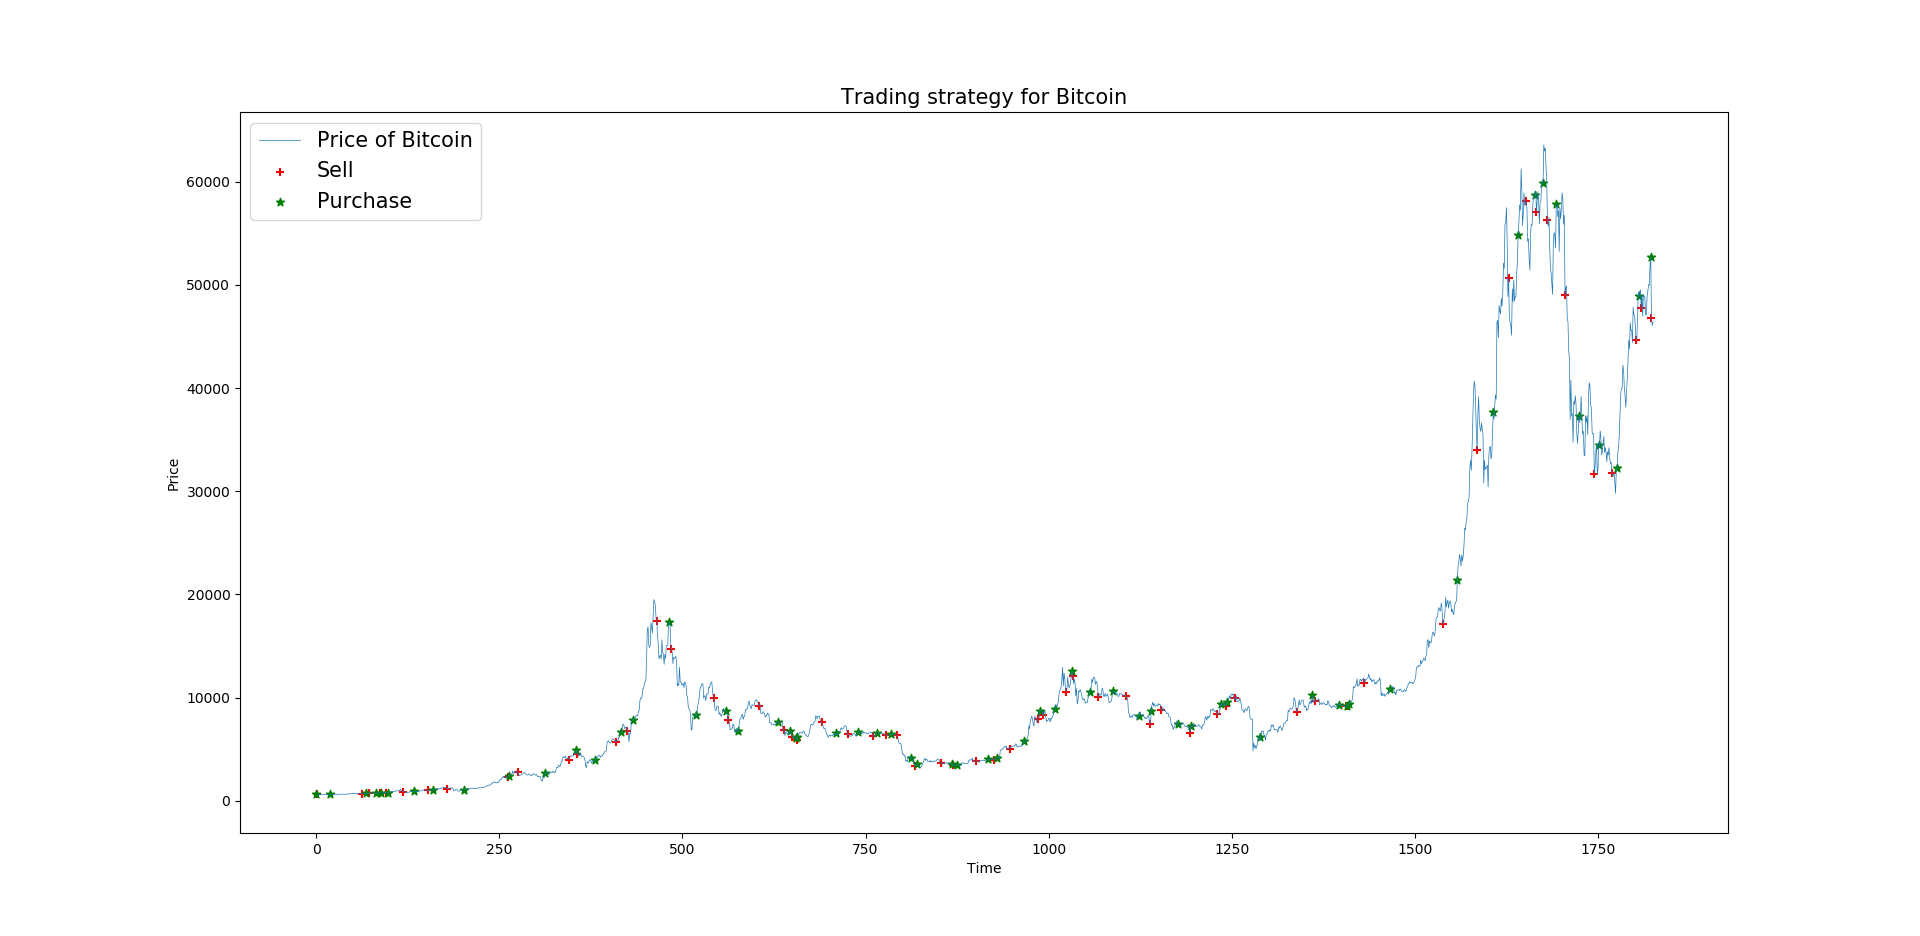
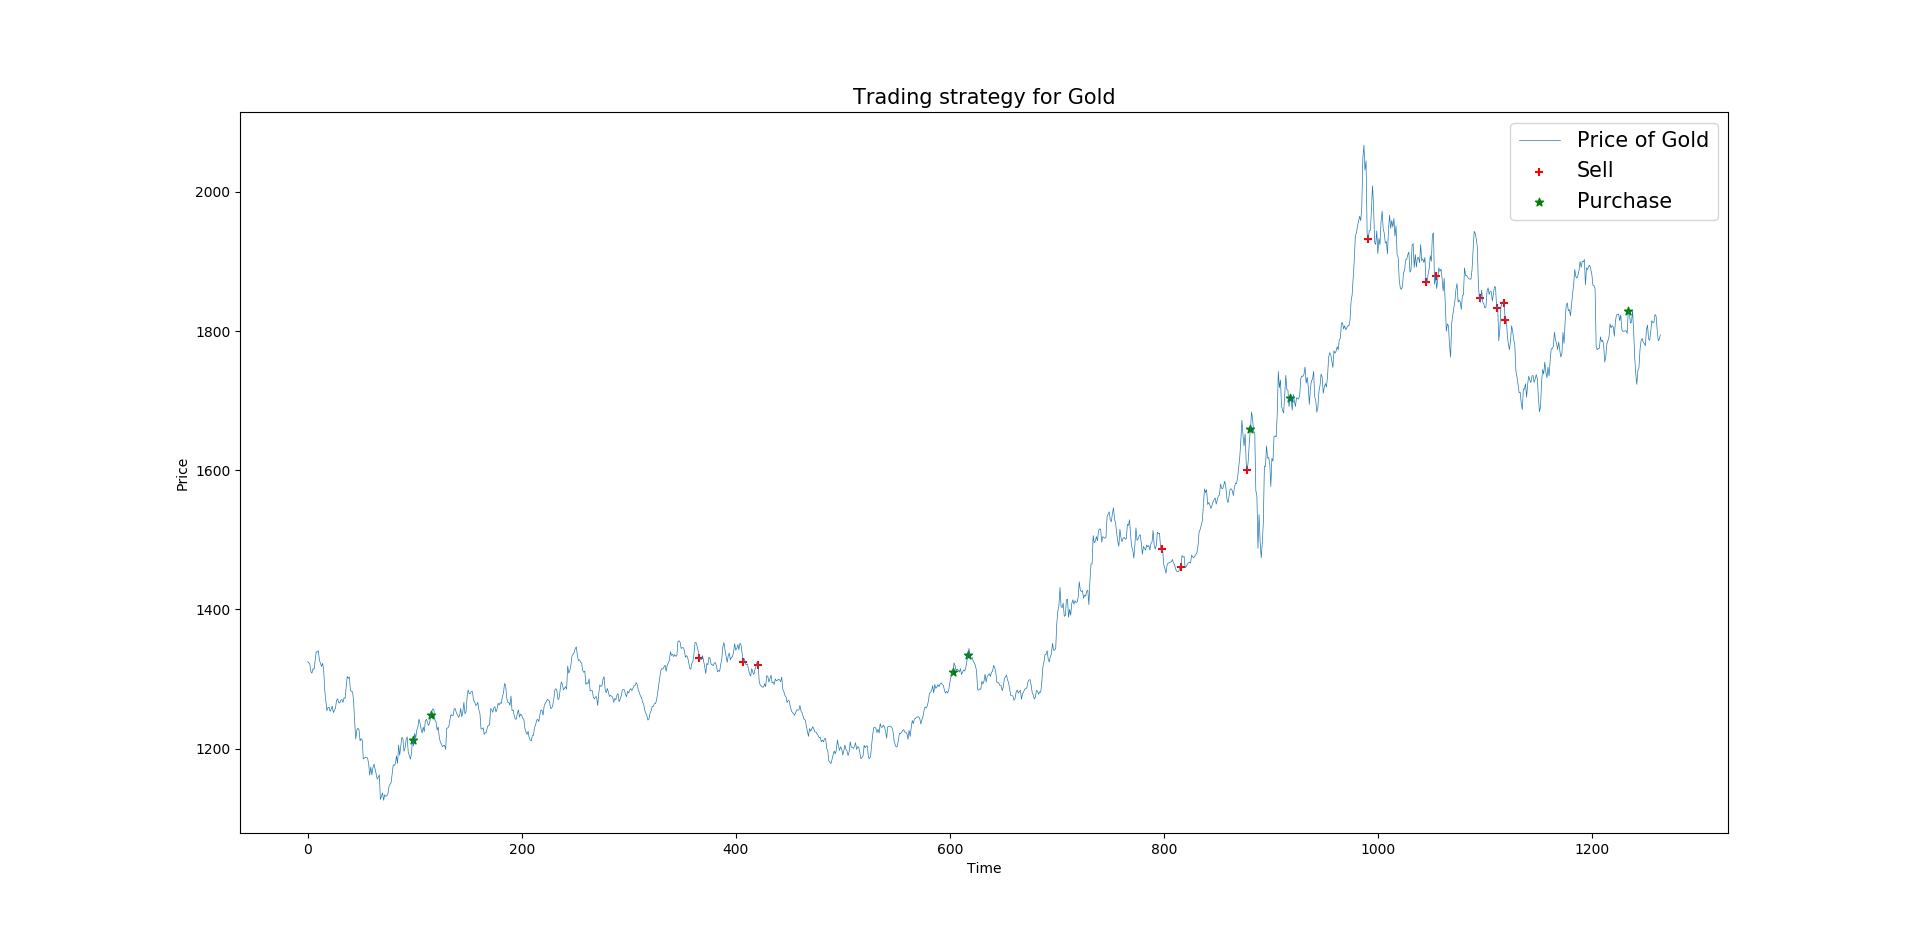
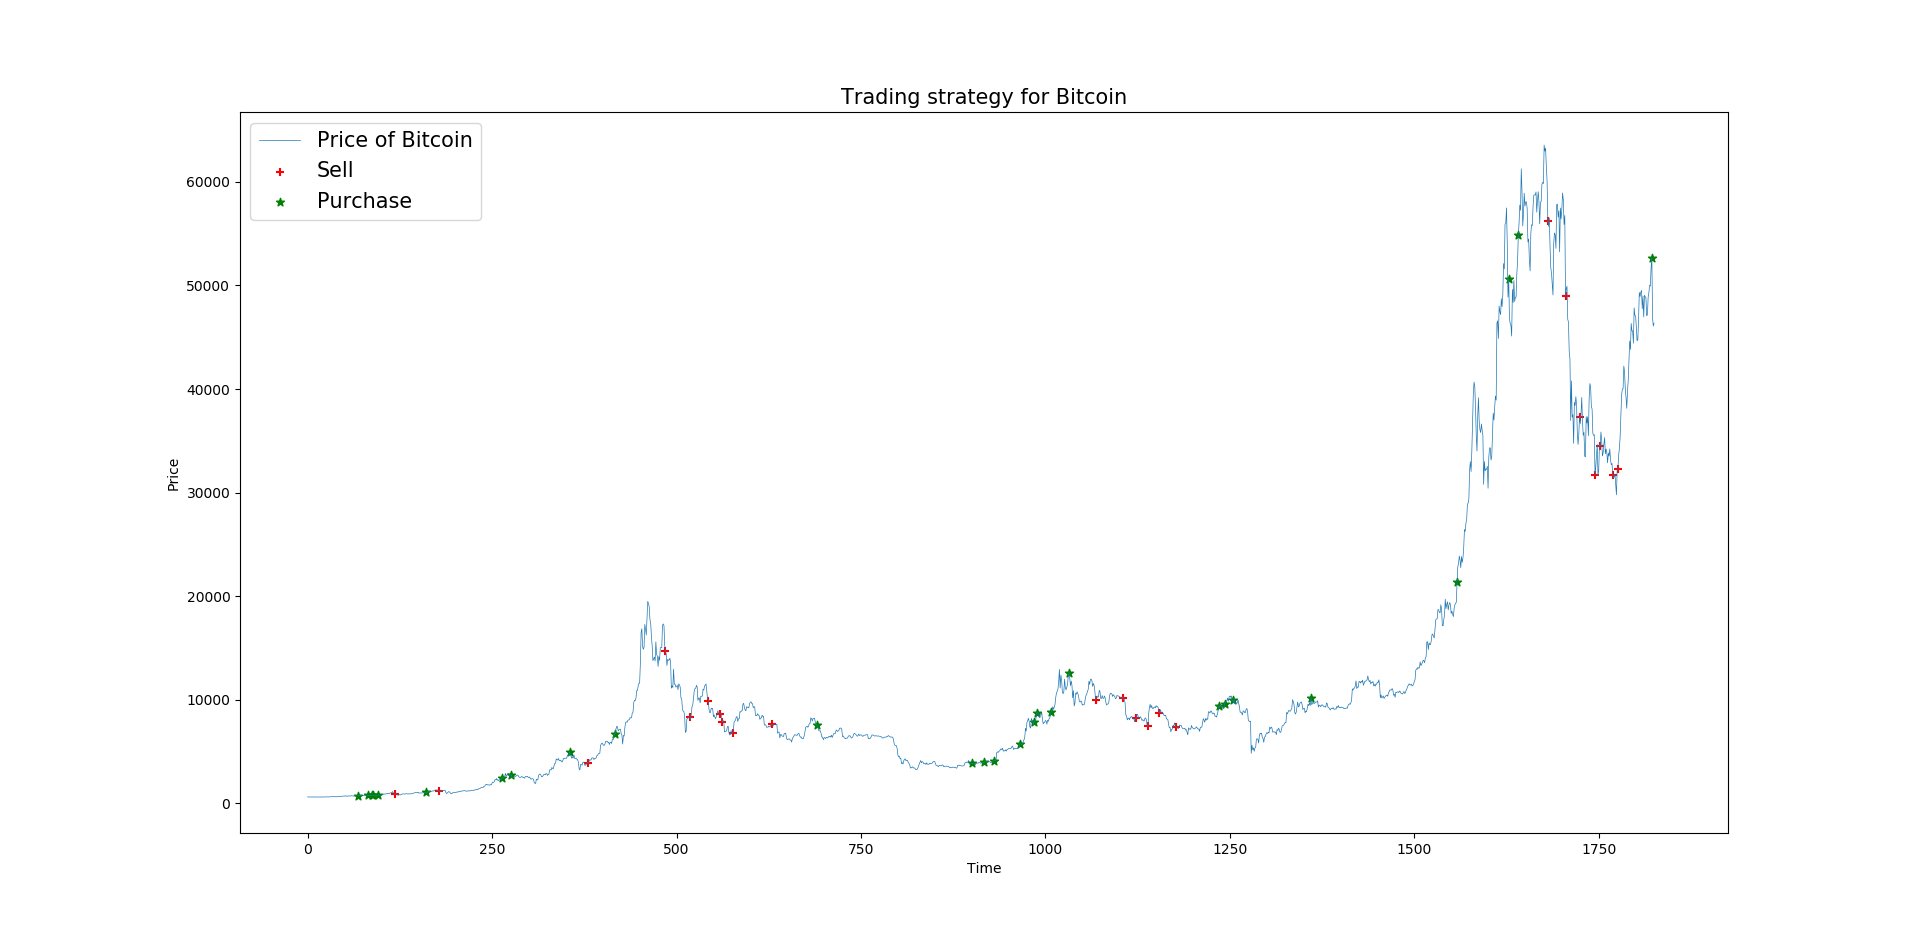
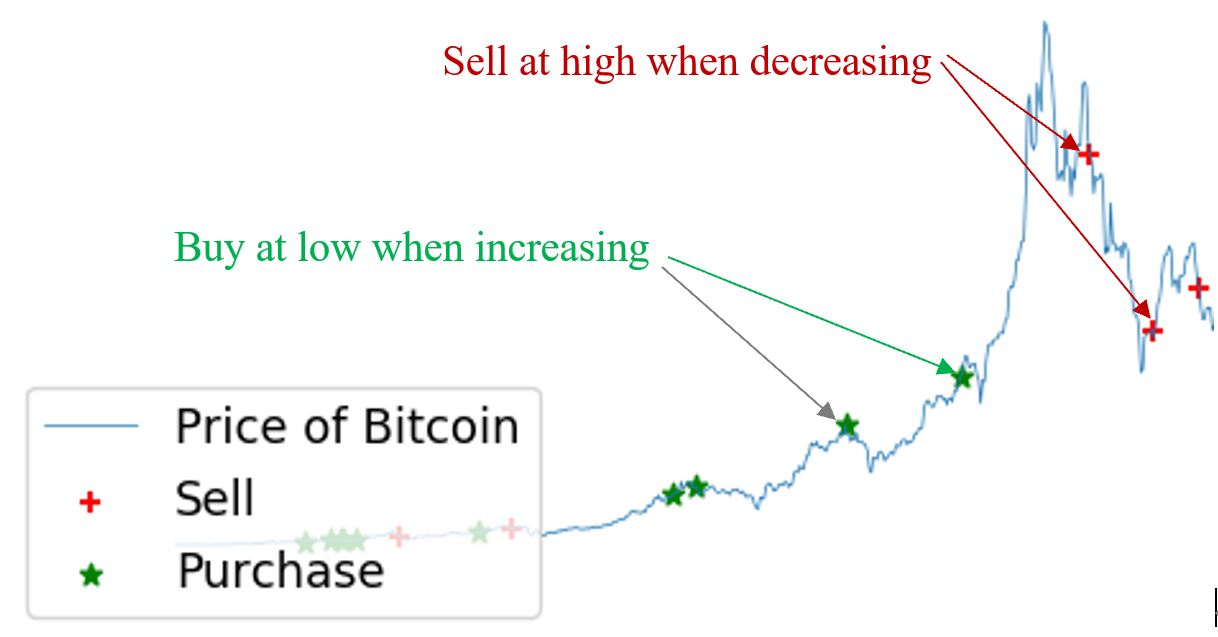

As shown in Table 2, the buy-and-hold strategy has the highest rate of return. The PLR-MACD model has the lowest absolute drawdown, indicating it involves the least initial risk in trading. However, both assets exhibit a 5-year overall uptrend, with bitcoin showing a particularly strong upward trend. This scenario does not accurately reflect how the three strategies would perform in a downtrend. To simulate such conditions, we reversed the daily prices of gold and bitcoin and tested the performance of the three strategies. Table 3 summarizes their performance in this simulated downtrend.

From Table 3, it is evident that in a downtrend, the PLR-MACD model achieves both the lowest absolute drawdown and the highest rate of return. Table 4 summarizes the trading performance of the three strategies in both overall uptrend and downtrend scenarios.

Judging from the trading performance from both an overall uptrend and an overall downtrend, we conclude that the PLR-MACD model provides the lowest risks and medium profits, proving that the PLR-MACD is our best (low-risk and profitable) model.
We were recognized as Meritorious Winner!
